 geodata-info
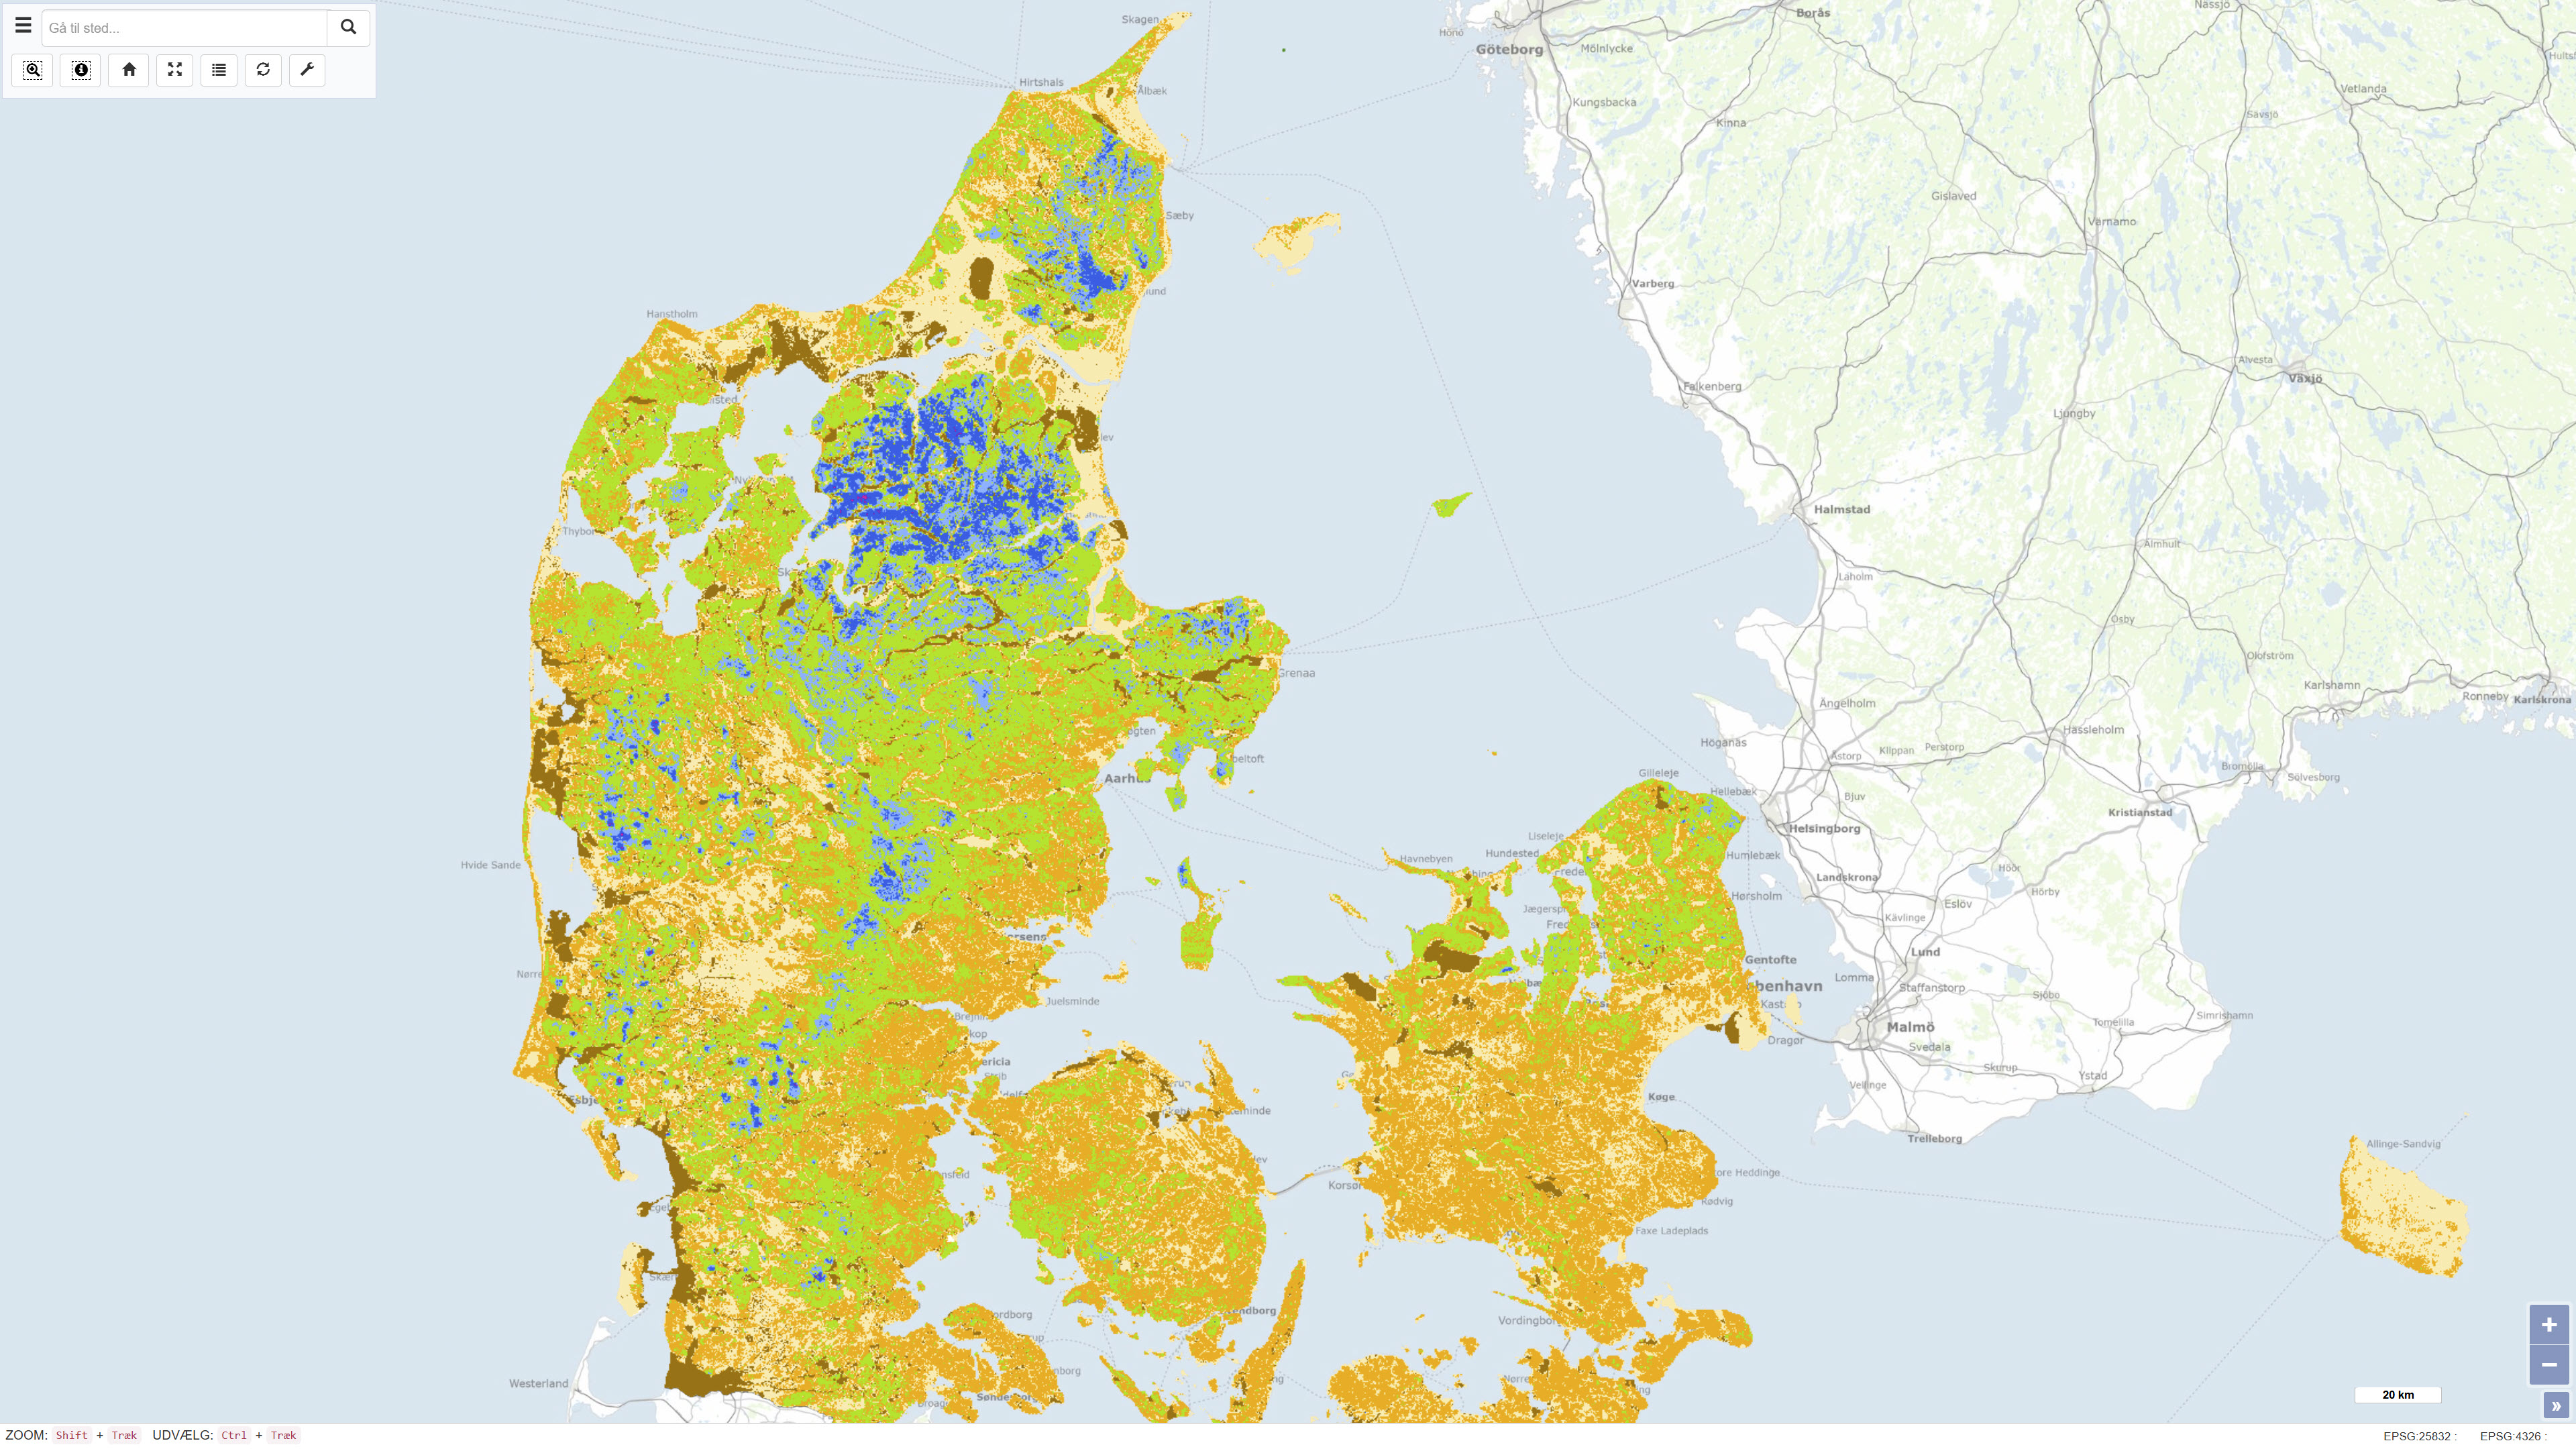
Dybden til redoxgrænsen, 100 m grid
The dataset shows the depth to the redox interface in metres below ground level across Denmark at a spatial resolution of 100 metres. The redox interface represents the transition between oxidised and reduced sediment layers and is a key hydrogeological parameter influencing processes such as nitrate reduction and groundwater chemistry. The map is based on a statistical model developed from approximately 13.000 observations of colour changes in sediment samples and represents the best estimate of the depth to the redox interface nationwide. The dataset also includes an associated uncertainty estimate describing the variability and robustness of the model results.
Simple
Identifikation
- Titel
-
Dybden til redoxgrænsen, 100 m grid
Offentliggørelsestidspunkt
- Dato (Publication)
- 2019-01-01
Ansvarlig myndighed og kontaktoplysninger
- Kontakt vedr. service
-
Organisationsnavn E-mail adresse Rolle The Geological Survey of Denmark and Greenland (GEUS)
Point of contact
- Metadata author
-
Organisationsnavn E-mail adresse Rolle The Geological Survey of Denmark and Greenland (GEUS)
Point of contact
Geografisk udstrækning
- Koordinatsystem
-
ETRS 89 / UTM 32N (EPSG:25832)
Nøgleord
- Nøgleord
-
Dataset
- Nøgleord
-
Geology
- Nøgleord
-
Redox interface
- Nøgleord
-
Groundwater
- Nøgleord
-
Hydrogeology
- Nøgleord
-
Nitrate reduction
- Nøgleord
-
Denmark
- Nøgleord
-
ArcGIS
- Type
- Theme
- Nøgleord
- Quaternary geology
- Nøgleord
- Soils and biogeochemistry
- Nøgleord
- Hydrology
- Type
- Theme
- Titel
- Forskningsemner
- Dato (Publication)
- 2025-11-03
- Nøgleord
- Denmark
- Type
- Place
- Titel
- Geografisk
- Dato (Publication)
- 2025-12-11
Kvalitet
- Type som metadata beskriver
- Dataset
- Beskrivelse
-
The map is based on approximately 13.000 observations of redox conditions identified as colour changes in sediment samples from boreholes. Based on these observations, a statistical model describing the relationship between depth to the redox interface and a range of explanatory variables was developed. The model was constructed using the machine learning method Random Forest and implemented on a nationwide grid with a spatial resolution of 100 metres. To quantify uncertainty in the estimated depths, residual Gaussian simulation was applied, allowing assessment of spatial variability and model uncertainty. The methodology and model development are documented in the scientific literature.
)))
